Purpose: Although ionization chambers are widely used to measure beam commissioning data, point-by-point measurements of all the profiles with various field size and depths are timeconsuming tasks. As an alternative, we investigated the feasibility of a linear diode array for commissioning a treatment planning system.
Methods: The beam data of a Varian TrueBeam® radiotherapy system at 6 and 10 MV with/without a flattening filter were measured for commissioning of an Eclipse Analytical Anisotropic Algorithm (AAA) ver.15.6. All of the necessary beam data were measured using an IBA CC13 ionization chamber and validated against Varian “Golden Beam” data. After validation, the measured CC13 profiles were used for commissioning the Eclipse AAA (AAACC13). In addition, an IBA LDA-99SC linear diode array detector was used to measure all of the beam profiles and for commissioning a separate model (AAALDA99). Finally, the AAACC13 and AAALDA99 dose calculations for each of the 10 clinical plans were compared.
Results: The agreement of the CC13 profiles with the Varian Golden Beam data was confirmed within 1% except in the penumbral region, where ≤2% of a discrepancy related to machinespecific jaw calibration was observed. Since the volume was larger for the CC13 chamber than for the LDA-99SC chamber, the penumbra widths were larger in the CC13 profiles, resulting in ≤5% differences. However, after beam modeling, the penumbral widths agreed within 0.1 mm. Finally the AAALDA99 and AAACC13 dose distributions agreed within 1% for all voxels inside the body for the 10 clinical plans.
Conclusions: In conclusion, the LDA-99SC diode array detector was found to be accurate and efficient for measuring photon beam profiles to commission treatment planning systems.
KeywordsRadiotherapy, Photon beam commissioning, Treatment planning system, Ionization chamber, Diode array detector
Introduction
Accurate measurement of the dose characteristics of a treatment beam is a key requirement for accurate determination of the dose delivered to a patient during radiation therapy. In beam commissioning, thimble ionization chambers with a 0.1-cc volume are the gold standard for measuring beam data, including output factors, depth–dose curves, and lateral profiles. However, point-by-point measurements with an ionization chamber are time-consuming tasks, and it is tedious to collect all of the profiles with various field sizes and depths for different energies. In addition, due to its large measurement size of 5–6 mm, the ionization chamber causes a volume-averaging effect that blurs the penumbras of lateral profiles. An alternative method to overcome these drawbacks of ionization chambers is to use a linear diode array detector to measure the lateral profiles. However, due to the higher atomic mass of the silicon in silicon diodes, the detector overresponds to low-energy photons that are more abundant in scatter, which increases with large fields and larger depths. Therefore, diodes intended for use in photon fields commonly also have a shield made of a high atomic number material (usually tungsten) integrated into the encapsulation to selectively absorb low-energy photons to which silicon diodes would otherwise overrespond [1,2].
A difficulty is the spectral variation over field size, depth, and off-axis distance (OAD) from the beam center that cannot be uniformly compensated by a single configured metallic compensator. The linear diode array detector, LDA-99SC (IBA Dosimetry, Schwarzenbruck, Germany) used in this study is also designed to shield low-energy scattered photons by applying a tungsten compensator plate beneath the diode detectors.
The study aim was to investigate the feasibility of using a linear diode array by comparing the results with those of an ionization chamber for commissioning of a treatment planning system.
Materials and Methods
For the beam commissioning of a TrueBeam® with Analytical Anisotropic Algorithm (AAA) EclipseTM treatment planning system ver.15.6 (Varian Medical Systems, Palo Alto, CA, USA), an IBA CC13 ionization chamber was used to measure all of the beam data collected for 6- and 10-MV photon energy beams under flattening filtered (FF) and flattening filter free (FFF) conditions. The beam data set for each beam energy included output factors, depth–dose curves, and lateral profiles at various field sizes and depths. The CC13 ionization chamber is widely used for beam commissioning and measurement of the representative beam data provided by Varian [3].
In addition, an IBA LDA-99SC linear diode array detector was used to measure the profile data for comparison with the CC13 ionization chamber data, which enabled assessment of the feasibility of the LDA-99SC. This detector consists of 99 Hi-pSi detectors spaced only 5 mm apart aligned in a row, so it can measure a range equal to the length of the detector array at the same time (Table 1).
Table 1 Characteristics of the LDA-99SC linear diode array detector and CC13 ionization chamber
FeatureCharacteristicLDA-99SCCC13| Type | Chip | Thimble cylinder |
| Detector material | Hi-pSi | C552* |
| Material density (g/cm3) | 2.33 | 1.76 |
| Typical sensitivity (nC/Gy) | 100 | 4.00 |
| Active detector diameter (mm) | 1.6 | 6 |
| Sensitive volume (cm3) | 1.6×10⁻⁴† | 0.13 |
| Detector axis alignment to beam axis | Parallel | Perpendicular |
The structure of the diode detector is different from that of the ionization chamber, and the structural characteristics cause a difference in the results when measuring the beam. In Table 1, the LDA-99SC and CC13 characteristics are compared. Ionization chambers re widely used for beam measurements because of their stable response over a range of energies, doses, and dose rates as well as its relatively low cost and high availability. However, the volume-averaging effect due to a finite detector size limits the spatial resolution, especially in small-field dosimetry [4]. Si diode detectors have advantages, such as a fast response time, high spatial resolution, and high sensitivity. On the other hand, there are also disadvantages, such as the dose rate, energy dependence, and overresponse to low-energy scattered radiation generated because of the relatively large photoelectric cross-section of silicon (z=14). This overresponse can be reduced by using a metal shield [1,2]. In the LDA-99SC, a thin tungsten plate is used under the diode chip to remove low-energy photons.
The LDA-99SC can save measurement time because its 99 diodes are arranged in an array. In particular, because the convolution effect is small when measuring the penumbral area, the profile drops sharply in the penumbra [5].
In this study, the following characteristic were compared and analyzed to investigate the feasibility of using the LDA-99SC for beam commissioning.
1. Comparison of the Varian Golden Beam (GB) profiles with the CC13 profiles
In this study, the CC13 ionization chamber was used to measure the profiles, which were used as the reference data. The CC13 profiles using a 0.12 cm step width, 0.3–0.5 cm/s scan speed, and 0.75 cm/s positioning speed were measured. To verify the reliability of the CC13 profiles measured in this study, before comparing the LDA-99SC, and CC13 profile measurements, the agreements between the measured CC13 profiles and Varian GB data were confirmed for the TrueBeam®’s four energies (6 MV, 6 MV FFF, 10 MV, 10 MV FFF), field sizes (3×3 cm2, 6×6 cm2, 10×10 cm2, 20×20 cm2, 30×30 cm2, 40×40 cm2), and depths (dmax, 5, 10, 20, 30 cm).
2. Comparison of the LDA-99SC profiles with the CC13 profiles
The LDA-99SC profile data were measured under the same conditions as used for the CC13 profile data, and the two datasets were compared and analyzed. The scan parameters were set with a 0.1 cm step distance, 0.3 cm/s in-scan positioning speed, and 1 second measurement time. Therefore, it took approximately 5 seconds to measure a single profile with the LDA-99SC. Although the scan time of the CC13 varied with the field size, it took 60–100 seconds on average to measure a single profile, which was 12–20 times longer than it took with the LDA-99SC. To quantitatively compare the profile of the FF beams (6 MV FF and 10 MV FF), and the FFF beams (6 MV FFF and 10 MV FFF), the penumbral widths determined by 80%–20% of the profile were compared. For the FFF beams, the penumbral widths were determined by Fogliata et al.’s method [6], which determined the inflection point of the dose profile to renormalize the FFF beam to the same dose level as that of the corresponding FF beam at the inflection point on the field edge. We applied the suggested renormalization factors of the FFF beams to determine the penumbral widths of the FFF beams (Table 2).
Table 2 Comparison of the penumbral widths measured with the LDA-99SC and CC13 and calculated with the AAALDA99 and AAACC13 beam models
EnergyMeasured penumbral width (mm)Calculated penumbral width (mm)LDA-99SCCC13AAALDA99AAACC13| 6 MV | 3.2 | 5.6 | 3.6 | 3.7 | |
| 6 MV FFF | 3.1 | 5.4 | 3.3 | 3.2 | |
| 10 MV | 4.1 | 6.3 | 4.6 | 4.6 | |
| 10 MV FFF | 3.8 | 6.1 | 4.3 | 4.3 |
3. Comparison of the LDA-99SC and CC13 beam models
Two independent beam data sets, including each profile data set measured separately using the CC13 and LDA-99SC, were imported into the Varian EclipseTM Beam Configuration and processed by the AAA ver.15.6 beam model to give the AAACC13 and AAALDA99 beam models. The effective target spot size in the X- and Y-directions that were necessary for AAA beam modeling were set to the default value of zero without any further tuning. Another important beam modeling parameter, the dosimetric leaf gaps of the Varian HighDefinition 120 Multileaf Collimator were determined using the methodology suggested by Wasbø and Valen [7], which was ranged from 0.0732 cm for 6 MV FFF to 0.091 cm for 10 MV. The AAALDA99 and AAACC13 dose profiles were compared.
4. Comparison of the AAALDA99 and AAACC13 clinical plans
To confirm the effect of the difference in the beam data due to the different detector types on the actual treatment plan after beam modeling, the dose distributions calculated by applying the AAACC13 and AAALDA99 beam models to the clinical plans were compared. Ten clinical plan cases, including treatment sites, such as the spine, lung, chest, liver, pelvis, and brain, were selected, and compared. Four energies (6 MV, 6 MV FFF, 10 MVA, 10 MV FFF) were used. All of the plans were originally generated with the AAACC13 beam model and then recalculated with the AAALDA99 beam model. A dose-subtraction map was generated to measure the voxel-by-voxel differences of the calculated dose distributions between the AAACC13 and AAALDA99 models. In addition, the dose statistics, such as the mean, minimum, and maximum dose for the planning target volume (PTV) as well as the entire dose calculation volume, were analyzed using the EclipseTM’s dose statistics function.
Results
1. Comparison of the CC13 and Varian GB data profiles
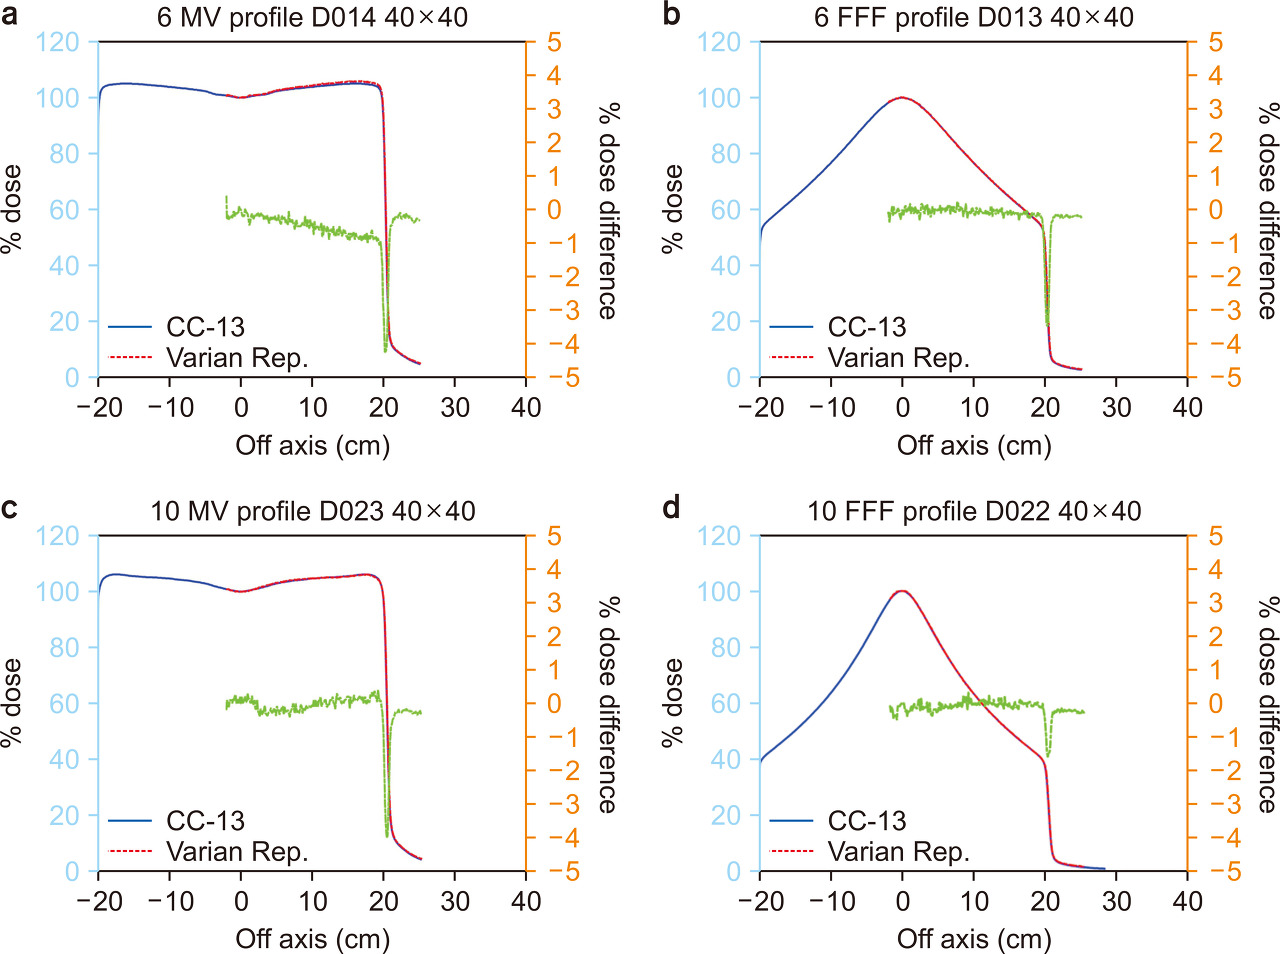
Fig. 1 shows a comparison of the typical dose profiles measured with the CC13 and Varian GB. After examination of all of the ranges of energies, field sizes, and depths, it was confirmed that the measured CC13 profiles in this study agreed within 1% with the GB profiles except for the penumbral region. In the penumbral region, the measurement results showed a difference of ≤4% between the CC13 and GB profiles. This greater difference was thought to be due to minute differences in jaw calibration depending on the equipment used.
2. Comparison of the LDA-99SC and CC13 profiles
Figs. 2 and 3 show comparisons of the CC13 and LDA-99SC profiles, respectively, measured at 6 MV, and 10 MV, with, and without the FF. In the penumbral region, ≤5% differences that rapidly changed from + to − were observed, which appeared to be caused by the difference in the detector sizes that caused a greater volume-averaging effect on the CC13 profiles than on the LDA-99SC profiles. For quantitative analysis, the penumbral width determined in 80%–20% of the dose profiles are summarized in Table 2. Regardless of the presence of the FF, the difference in the penumbral widths were greater at 10 MV than at 6 MV by approximately 1 mm. Additionally, as the OAD increased, the measurement became slightly lower when using the LDA-99SC than when using the CC13. The difference was slightly greater for the FF beam than for the FFF beam, which may have been caused by the metallic compensator of the LDA-99SC (discussed later).


3. Comparison of the AAALDA99 and AAACC13 beam models
After beam modeling, the profiles calculated by the AAALDA99 were compared with those calculated by the AAACC13 at 6 MV and 6 MV FFF in Fig. 4 and for 10 MV and 10 MV FFF in Fig. 5, respectively.

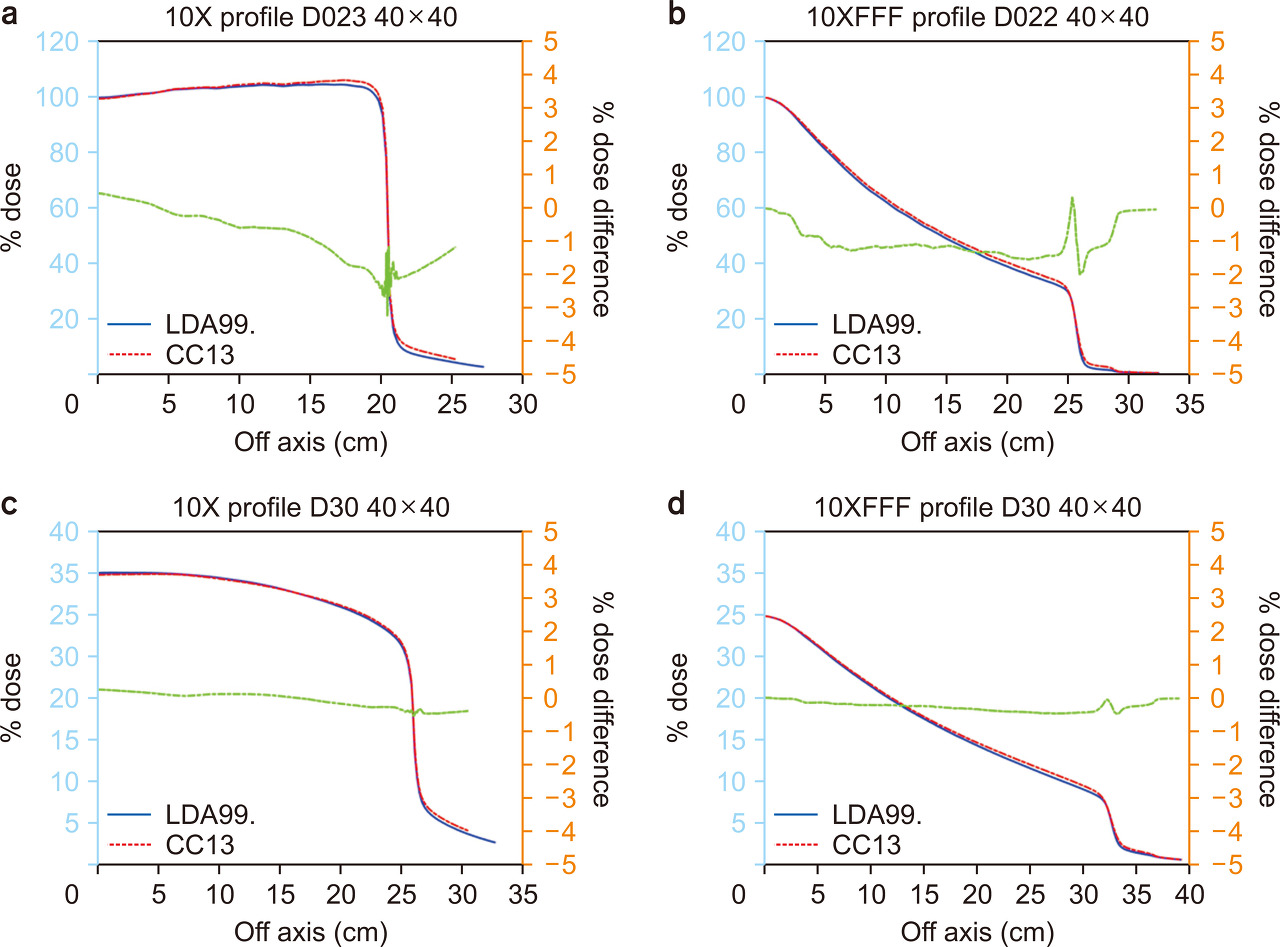
A comparison of the LDA-99SC and CC13 measurement profiles (at 6 MV, Fig. 2; at 10 MV, Fig. 3) showed a reduction in the profile differences between the beam models. Especially in the penumbral region, the differences were significantly reduced to ≤1% (Fig. 4 and 5). This reduction was because after beam modeling, the penumbral widths of the CC13 became closer to those of the LDA-99SC, whereas the latter did not significantly change after beam modeling (Table 2). After modeling, the penumbral width differences between the two detectors were almost identical (≤0.1 mm).
4. Comparison of the AAALDA99 and AAACC13 clinical plans
As summarized in Table 3, the mean dose difference between AAALDA99 and AAACC13 agreed within 0.5% in the PTV and within 0.4% in the body for each clinical plan. The average maximum point dose difference between the AAALDA99 and AAACC13 was −1.5% (−3.3% to −0.2%). A typical AAALDA99 and AAACC13 dose-difference map is shown in Fig. 6, with the dose profiles across the PTV in the cranial–caudal direction. The map shows a rapid change from + to – when crossing the beam margin, which indicates a subtle difference in the penumbral width between the AAALDA99 and AAACC13 beam models.
Table 3 Dose differences between AAALDA99 and AAACC13 for 10 clinical treatment plans with various disease sites, energies with a FF and FFF, and treatment volumes
EnergyPlan techniqueTreatment sitePrescription (Gy)PTV (cm3)Mean dose difference (AAALDA99−AAACC13)Max dose difference (AAALDA99−AAACC13)PTVBodycGy%cGy%cGy%| 6 MV FF | 2 full arcs VMAT | Brain | 35 | 22.21 | 6.1 | 0.1 | −0.6 | −0.2 | 43.9 | −1.0 | ||
| 6 MV FF | 2 full arcs VMAT | C-Spine | 45 | 364.54 | 17.6 | 0.4 | −3.6 | −0.1 | 30.2 | −0.7 | ||
| 6 MV FF | 9 fields IMRT | Lung | 40 | 812.75 | −19.0 | −0.3 | −20.2 | −0.4 | 127.8 | −3.2 | ||
| 6 MV FF | 7 fields IMRT | Chest | 50 | 364.54 | 2.3 | 0.2 | −0.9 | −0.1 | 11.3 | −0.2 | ||
| 6 MV FFF | 2 half arcs VMAT | Lung | 32 | 77.92 | 14.2 | 0.5 | −0.2 | 0.0 | 104.1 | −3.3 | ||
| 6 MV FFF | 2 half arcs VMAT | Lung | 54 | 5.49 | 15.9 | 0.3 | 0 | 0.0 | 99.7 | −1.8 | ||
| 10 MV FF | 2 full arcs VMAT | Pelvis | 30 | 405.38 | −0.1 | 0.0 | −3.5 | −0.1 | 32.7 | −1.1 | ||
| 10 MV FF | 2 half arcs VMAT | Pelvis | 30 | 200.33 | −2.1 | 0.0 | −1.6 | −0.1 | 24.4 | −0.8 | ||
| 10 MV FFF | 2 half arcs VMAT | Liver | 45 | 32.69 | −90.0 | −0.2 | −0.4 | −0.1 | 74.4 | −1.7 | ||
| 10 MV FFF | 2 half arcs VMAT | Liver | 45 | 20.79 | 9.5 | 0.2 | −0.3 | 0.0 | −43.0 | −1.0 |

Discussion
As shown in Figs. 2 and 3, in the out-of-field region, the dose profiles of LDA-99SC are relatively lower than those of CC13. Additionally, the dose profiles obtained with FF beams were ~1% lower than those obtained with FFF beams. However, this tendency seems to begin inside the field as the OAD increases because of the energy dependency of the LDA-99SC, which differs from that of CC13. Since silicon in the Si diode of the LDA-99SC has an atomic mass of 28, overresponse may occur by absorbing many more low-energy photons than water, which has a molecular weight of 18. Therefore, the LDA-99SC detector is structurally designed to shield low-energy scattered photons to some extent for the purpose of compensation [8]. However, considering the FF shape, the distribution of low photons filtered by the FF varies depending on the OAD. The closer to the beam center, the more low-energy photons are filtered, and thus beam hardening occurs; conversely, more low-energy photons are left with increasing OAD, which has a beam-softening effect. Therefore, the LDA-99SC would over-compensate for the low-energy scatter by increasing the OAD, resulting in LDA-99SC measured profiles that are slightly lower than the CC13 profiles. On the other hand, since the FFF beam has no FF, its photon beam spectra will be similar regardless of the OAD and thus less affected by the over-compensation. This explanation is not conclusive and thus needs to be further addressed. In addition, the over-compensation of the LDA-99SC increases as the depth increases with more low-energy photons due to increasing phantom scatter.
In Table 2, which shows a quantitative comparison of the penumbral width, for the LDA-99SC, there was no significant difference in penumbral widths during measurement and after modeling. As shown in Table 1, the active detector size of the LDA-99SC is as small as 1.6 mm and thus has little effect on the volume-averaging effect. On the other hand, the penumbral width for the CC13 measured value is relatively larger than the LDA-99SC value because the detector size is about 5–6 mm, resulting in a large volume-averaging effect. However, the AAACC13 penumbra, after Eclipse beam modeling, was similar to the AAALDA99 penumbra. This result can be explained by correction of the CC13 volume-averaging effect through modeling. Therefore, after beam modeling, the penumbral width difference between the two detectors was ≤0.1 mm.
As shown in Fig. 6, the dose difference between the AAALDA99 and AAACC13 changed rapidly from + to – when crossing the beam margin, which indicated a remaining subtle difference in the penumbral widths between the AAALDA99 and AAACC13 beam models.
Conclusions
Comparison of the LDA-99SC and CC13 measured and calculated profiles is considered the gold standard for evaluating a detector for beam commissioning. Subtle differences were observed in our comparison that were caused by differences in detector sizes and energy dependencies. However, the differences were not significant and even smaller when comparing the clinical IMRT and VMAT plans. Therefore, these differences were judged to be at clinically acceptable levels, indicating that the LDA-99SC detector is an efficient and accurate detector that is suitable for photon beam commissioning of a treatment planning system.
Conflicts of Interest
The authors have nothing to disclose.
Availability of Data and Materials
The data that support the findings of this study are available on request from the corresponding author.
Author Contributions
Conceptualization: Jungwon Kwak and Byungchul Cho. Data curation: Seung Mo Hong and Uiseob Lee. Formal analysis: Seung Mo Hong and Uiseob Lee. Investigation: Sung-woo Kim and Youngmoon Goh. Methodology: Min-Jae Park and Chiyoung Jeong. Writing – original draft: Seung Mo Hong and Uiseob Lee. Writing – review & editing: Jungwon Kwak and Byungchul Cho.
References
-
Eklund K, Ahnesjö A. Modeling silicon diode energy response factors for use in therapeutic photon beams. Phys Med Biol. 2009;54:6135-6150.


-
Griessbach I, Lapp M, Bohsung J, Gademann G, Harder D. Dosimetric characteristics of a new unshielded silicon diode and its application in clinical photon and electron beams. Med Phys. 2005;32:3750-3754.


-
Glide-Hurst C, Bellon M, Foster R, Altunbas C, Speiser M, Altman M, et al. Commissioning of the Varian TrueBeam linear accelerator: a multi-institutional study. Med Phys. 2013;40:031719.


-
Palmans H, Andreo P, Huq MS, Seuntjens J, Christaki KE, Meghzifene A. Dosimetry of small static fields used in external photon beam radiotherapy: summary of TRS-483, the IAEA-AAPM international Code of Practice for reference and relative dose determination. Med Phys. 2018;45:e1123-e1145.


-
Barraclough B, Li JG, Lebron S, Fan Q, Liu C, Yan G. A novel convolution-based approach to address ionization chamber volume averaging effect in model-based treatment planning systems. Phys Med Biol. 2015;60:6213-6226.


-
Fogliata A, Garcia R, Knoos T, Nicolini G, Clivio A, Vanetti E, et al. Definition of parameters for quality assurance of flattening filter free (FFF) photon beams in radiation therapy. Med Phys. 2012;39:6455-6464.


-
Wasbø E, Valen H. Dosimetric discrepancies caused by differing MLC parameters for dynamic IMRT. Phys Med Biol. 2008;53:405-415.


-
Eklund K, Ahnesjö A. Spectral perturbations from silicon diode detector encapsulation and shielding in photon fields. Med Phys. 2010;37:6055-6060.
매우 흥미로운 주제였다. 특히, 최근에서야 빔 프로파일 측정과 관련된 정보를 습득하며 그것의 시간 소모가 상당하다는 것을 교수님으로부터 들었는데 이와 관련된 논문이 바로 나와 있었다. 그렇기에, 검출기 어레이, 그 중 선형으로 배열된 다이오드의 성능을 평가하는데 있어 이 논문은 상당히 흥미로웠다.
Varian 사의 Truebeam Series를 이용해 6 MeV와 10 MeV의 에너지 빔에 대해 각각 FFF(Flattening Filter Free)방식으로 AAA의 커미셔닝을 위해 측정했다. 이는 IBA의 CC13 이온 챔버를 통해 설정되었으며, LDA-99SC 선형 다이오드 어레이 검출기를 이용한 방식과 별도의 모델을 만들어 사용했다. 이에 대해 깊게 들어가면 다음과 같아진다.
선량의 정확한 전달이 방사선 치료에 있어 가장 정확한 수단임을 논문에서는 명시함과 동시에, 지두형 전리조(Thimble Chamber)가 특이 가장 중요한 기준(Gold-Standard)로 사용된다는 것을 밝혔다. 그렇지만, 상기한 이야기와 같이 시간이 상당히 많이 걸리며, 특히나 5*6mm의 작은 면적으로 인해 반음영을 흐리게 하는 효과, 즉 체적 평균 효과(Volume-Averaging Effect)를 만들어낸다는 것을 밝혔다. 다시 말해, 측면 프로파일의 흐림을 유발하는 Artifact가 일어날 수 있다는것이었다.
논문에서는 이러한 문제점의 극복 방향으로 선형 어레이를 언급하나, 물론 이에 대해 특히 실리콘(Silicon) 재질의 저에너지 광자에 대한 빛 번짐 또한 고려하며 텅스텐으로 이루어진 차폐를 통해 선택적 흡수가 일어나야 하는 것을 말하고 있다.
이러한 고찰을 가운데로, 논문에서는 이온 챔버를 대신한 선형 어레이 형식의 기능을 파악해 교체 가능성을 언급하고 있다.
상기한 듯이, Varian 사의 Truebeam을 이용해 AAA Algorithm을 사용하고, 평탄화 필터가 있을 경우와 없을 경우를 상정해 6, 10 MeV의 광자를 조사하였다. 이러한 과정을 통해 선량 곡선과 측면 프로파일을 얻을 수 있었고, 이때 사용된 CC13 이온 챔버는 평소 Varian이 선량 곡선과 측면 프로파일을 얻을 때 자주 사용한 이온챔버임을 밝혔다.
그와 반대로, IBA LDA-99SC 검출기를 통해, 5mm 간격의 99개의 Hi-pSi 검출기로 동시에 배열의 길이와 동일한 범위를 측정할 수 있었음을 표 1에서 밝히고 있다.
기본적으로 연구에서 사용한 다이오드는 이온 챔버와 구조가 다르며, 이때 빛의 검출 방식이 결과의 차이를 가져온다는 것이 가장 큰 내용이었다.
표1을 살펴 보았을 때, 에너지, 선량, 선량률에 대한 안정적 반응을 보이는 이온 챔버는 많은 곳에서 이용이 되지만 검출기의 면적으로 인해 상기한 체적 평균 효과가 일어나게 되며 공간 해상력을 악화시키게 된다. 반대로, Si 검출기는 빠른 응답시간과 높은 공간 해상력, 그리고 감도를 갖고 있지만 산란선에 의해 선량률, 에너지 의존성이 존재하며 과민 반응이 일어나는데 이를 텅스텐으로 막는 것이 대체할 수 있는 방법으로 논의된 것을 논문에서 찾을 수 있다.
논문에서는 Golden Beam 프로파일과 CC13 이온 챔버를 이용한 비교를 하여, CC13 이온 챔버를 기준 데이터로 고정하였다. 각 Width와 속도를 다르게 하여 측정하게 되었는데, 이때의 신뢰도를 위해 각 프로파일의(3가지 프로파일이다. GB를 이용한 프로파일, CC13 이온 챔버를 이용한 프로파일, LDA-99SC를 이용한 프로파일.) 비교, 비교하기 전의 데이터를 얻었다.
동일한 조건에서의 LDA-99SC와 CC13 이온 챔버의 Scan Parameters를 고정한 상태로 LDA는 단일 프로파일을 스캔하는데 5초가 걸린 반면, 이온 챔버는 60-100초가 걸리게 되었다. 이는 12-20배 더 길게 측정된 값이었다. 또한 FF와 FFF 상태의 반음영과 같은 경우는 표2와 같이 얻어졌다.
더불어, 실제 치료 계획에 미치는 영향을 알아보기 위해 빔 모델을 임상 계획에 적용하여 계산한 선량 분포를 비교한 결과, 이에 대한 선량통계를 연구에서는 얻게 되었다.
결과적으로는 검출기의 크기 차이와 에너지 의존성 차이가 발견되었으나, 그에 따른 IMRT와 VMAT의 계획을 비교했을 때 그 차이는 더 작아진 것으로 결론이 나왔다. 이는 LDA-SC99 검출기가 성능으로 생각한다면 이온 챔버에 비해 더욱 우수한 성능을 가질 수 있다는 것을 의미한다.